Dynamic KPI and P&L Configuration in Power BI: A Flexible, Configuration-Driven Approach

What if business users could change their key performance indicator (KPI) definitions and Profit and Loss (P&L) structures in Power BI without changing the underlying data model or backend implementation?
This question inspired our project: building a flexible reporting solution that separates business definitions from technical implementation.
In many traditional reporting solutions, developers embed KPI calculations, account mappings, and P&L hierarchies in backend logic or the semantic model. As business requirements evolve, even relatively small changes can require development effort, testing, and deployment. This creates particular challenges when different departments or users need different views of the same financial data.
Our approach makes these definitions configurable. By combining Databricks for data processing with Power BI for reporting and visualization, we developed a solution that lets users define their own KPIs, calculations, and P&L structures while keeping the underlying technical implementation stable.
In this article, we explore the architecture behind the solution, explain how configuration drives the reporting experience, and show how multiple configurations can coexist within the same framework.
Table of contents
Estimated reading time: 7 minutes
1. The Core Idea: Separate Business Logic from Technical Implementation
The main design principle was simple: business definitions should come from configuration rather than hardcoded logic.
Instead of embedding every account mapping, KPI formula, and hierarchy directly into the processing logic or Power BI report, we moved these definitions into configuration tables.
Users can configure:
- Which accounts contribute to each KPI.
- How the solution calculates P&L elements, including sums and ratios.
- How KPIs and P&L elements fit into a hierarchy.
- Which labels and sort orders appear in the report.
- How many hierarchy levels the report displays, up to six.
For example, two business units might use the same underlying financial data but calculate operating profit differently or organize their P&L reports according to different reporting standards.
With a configuration-driven approach, both business units can use their preferred definitions and reporting structures without changing the underlying technical implementation.
2. Solution Architecture
The solution uses three configuration tables, each responsible for a distinct part of the reporting logic.
2.1 Accounts and KPIs
The first table (Figure 1.) defines the relationship between financial accounts and KPIs. It specifies which accounts contribute to each KPI, allowing the composition of a KPI to be changed without modifying the underlying processing code.
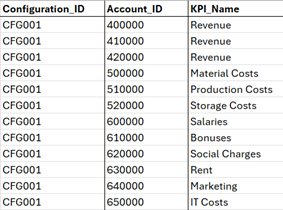
Figure 1. Account and KPIs mapping with configuration ID.
For example, a revenue KPI might include several account groups. If the business changes which accounts belong to revenue, the mapping can be updated in the configuration.
During data processing, account-level values are assigned to the corresponding KPIs according to these mappings.
2.2 Calculations and Hierarchy
The second table (Figure 2.) defines how P&L hierarchy elements are calculated from KPIs.
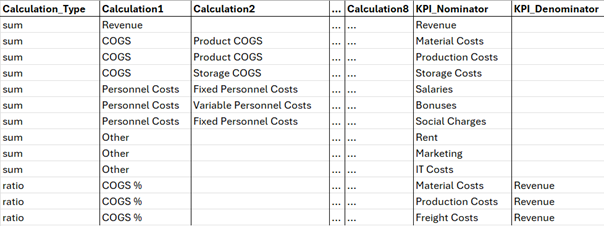
Figure 2. The P&L definition.
It supports aggregation-based calculations, such as summing several KPIs, as well as ratio calculations, where one KPI serves as the numerator and another as the denominator.
For example, a profit margin could be calculated by dividing profit by revenue. By storing the calculation definition in configuration, the solution can support different calculation rules without requiring a new implementation for each KPI or P&L element.
This creates a consistent way to manage financial calculations while allowing business definitions to evolve.
2.3 P&L Presentation
The third table (Figure 3.) controls how the P&L is presented in Power BI.
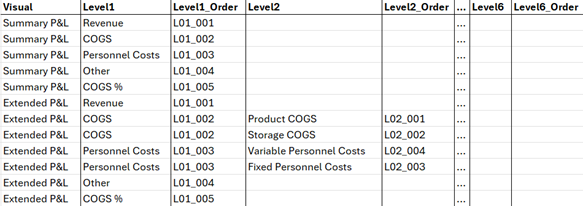
Figure 3. The P&L view definition.
It defines which KPIs and hierarchy elements appear in the report, how they are grouped, and where they sit within the hierarchy. It also stores display labels and sort orders, supporting up to six configurable hierarchy levels.
This separation is important because the way financial information is calculated does not necessarily determine how it should be presented.
For instance, one report might group results by business unit, while another organizes them by revenue, costs, and profitability. Both can use the same underlying data while presenting it according to different business requirements.
3. The Semantic Data Model
The semantic data model connects the processed financial values with the configurable business definitions.
At the backend level, account-level financial values are aggregated and assigned to the corresponding KPIs. The resulting values are stored in a fact table, which references KPIs through their IDs.
Dimension tables provide the information required to organize these values, including the P&L hierarchy and the relationships between KPIs and hierarchy elements.
Power BI uses the KPI IDs to retrieve and aggregate the relevant values from the fact table. The dimension tables provide the hierarchy, labels, and ordering needed to display the results in a P&L matrix.
The key advantage is that the financial data and its presentation are decoupled. Changing an account-to-KPI mapping, adjusting a calculation, or restructuring the hierarchy does not inherently require the underlying financial values to be changed.
Instead, the relevant configuration is updated and incorporated into the processing and reporting workflow.
This allows the same financial data to support multiple business perspectives without duplicating the entire data model or creating separate reports for every variation.
4. Managing Multiple Configurations and Versions
Different users and business areas often have different reporting requirements. To accommodate this, every KPI and P&L setup is assigned a unique configuration ID.
This ID identifies the set of business definitions used for a particular reporting scenario. It keeps account mappings, calculation rules, and presentation settings associated with the appropriate configuration.
Multiple configurations can coexist within the same solution, allowing different users to view the P&L according to their individual requirements.
For example, a finance team could maintain a standard corporate P&L while a business unit uses a customized hierarchy and KPI definition. Both configurations can reference the same underlying financial data.
This also makes configuration changes easier to manage. New definitions can be introduced or existing ones adjusted without building an entirely separate reporting solution.
The configuration ID provides the mechanism for distinguishing these definitions; appropriate filtering and processing logic ensure that each report uses the intended configuration.
5. Key Benefits of the Approach
The configuration-driven design offers several practical advantages:
- Flexibility: KPI definitions, calculations, and P&L hierarchies can evolve as business requirements change.
- Reusability: Multiple reporting scenarios can share the same underlying data and technical framework.
- Maintainability: Business definitions are separated from processing logic and the semantic model, reducing the need for code changes for configuration-level adjustments.
- Consistency: A common processing framework helps apply calculation and mapping rules consistently.
- Scalability: Additional configurations can be introduced without creating a completely separate solution for each business unit.
There is one important consideration: configuration changes do not eliminate every technical dependency. New calculation types, changes to the underlying data structure, or unsupported reporting requirements may still require development. The benefit is that changes within the supported configuration framework can be managed without modifying the core implementation.
6. Conclusion
The objective of this project was to build a flexible P&L reporting framework in which business logic and report presentation can be adapted independently of the underlying financial data.
By separating account mappings, KPI calculations, hierarchy definitions, and presentation settings into configuration tables, we created a solution that supports multiple reporting requirements within a shared Databricks and Power BI architecture.
The result is a more adaptable reporting environment where users can define how financial information is calculated, structured, and displayed without requiring a separate technical implementation for every variation.
The key takeaway: A configuration-driven approach turns the P&L from a fixed report into a reusable reporting framework – one that can evolve with business needs while keeping its underlying data architecture stable.