
Observability in Cloud Native

Cloud Native is transforming the way applications are designed and developed, leveraging the benefits of cloud computing infrastructure and services. Its applications are often associated with micro-services architecture, which makes them flexible, scalable, and self-healing.
At synvert, our team was tasked to improve the developer experience and resource optimization of a developer platform. Our solution meant working on a multi-tenancy, multi-cloud Kubernetes solution for a leading automotive company. The project stack includes the usual suspects, CI/CD, database as a service, and observability, utilizing cloud-native approaches.
As we all know, observability is a critical component of modern systems management, enabling organizations to have a comprehensive view of system performance and behavior, and quickly resolve any issues that arise. However, centralized observability in Cloud Native environments has been a persistent challenge.
In this article, we’ll examine the challenges of observability in Cloud Native, introduce the solution offered by open telemetry, and show how it can be used to achieve centralized observability. Join us as we explore the innovative technologies and practices shaping the future of Cloud Native development!
Setting up observability is hard
Teams typically build observability for their systems and applications by using a variety of embedded monitoring features in proprietary tools and solutions. This approach is often challenging because it requires teams to use different tools and methods to collect and report data from different services, which makes it decentralized and harder to have a comprehensive view of the overall performance and behavior of a system. Additionally, it makes it almost impossible to correlate data from different systems and quickly identify and troubleshoot issues.
Observability setup is hard, no questions about it. Our goal, as an additional feature to the developer platform product we are developing, is to offer customers easy access to telemetry data through a centralized portal. To achieve this, we use tools like Fluent Bit, Prometheus, and OpenSearch to collect, transform, and load data. But, just tools aren’t enough… an observability strategy has to be in place.
Let’s review two common challenges.
1. Non-standardised data
To build a centralized observability platform, customers need to implement /metrics endpoints and output logs in a specific format. This is a challenging task for big teams in decentralized environments. Teams who are going through the journey of becoming a DevOps organization still have Ops and Platform teams usually relying on the customer’s application language, frameworks, and libraries to extract data that they don’t control.
2. Hard to correlate data
The capability of doing correlation between the three data observability streams (Logging, Monitoring, and Tracing) is very important when a Cloud Native system is being developed. These are the 3 pillars of observability, however, if they can’t be correlated we lose the biggest benefit of having them centralized. The method that we see teams doing and usually find faces this problem, each stream of data is treated differently. Besides that, having non-standardized data does not help, making correlation even harder.
The problems mentioned above are keeping teams from improving. Our developer platform had a different approach regarding observability features for customers. It was part of the strategy to find a solution that ensures the three pillars (logging, monitoring, and tracing) could be correlated.
Observability strategy with standardization
Open telemetry is an open standard for collecting and reporting telemetry data. It provides a standard way to collect data from various systems and services, regardless of the technology or vendor. It enables organizations to collect data from a wide range of applications, regardless of the programming language or codebase used. This is possible because open telemetry provides a consistent data model for collecting and reporting telemetry data, and it also provides libraries and SDKs for various programming languages that can be used to instrument the code and collect data.
With open telemetry, organizations can standardize their metrics, logs, and traces by using a common schema, format, and protocol. This makes it possible to analyze data from various sources using the same tools and processes and to correlate data from different sources to gain a more comprehensive understanding of the system’s overall performance.
Single braid and multiple integrations
Open Telemetry, solves the major obstacles hindering the improvement of our product. Many well-known APM platforms, such as Datadog, adopt a similar approach as Open Telemetry, offering a language-specific proprietary SDK to automatically transmit telemetry data for their services.
Open Telemetry can be divided into two main high level components:
1. Instrumentation
Open telemetry provides an official SDK for the most popular languages. This allows developers, by including this SDK on the code base, to start instrumenting their applications. For languages like Java and PHP, which rely on a runtime to run, is even possible to use the OTL SDK without updating the code using open telemetry add-on/extension.
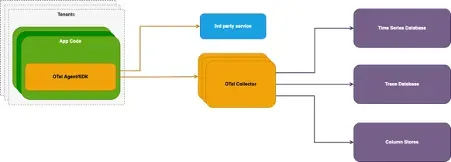
2. Collector
The collector component is a central hub responsible for receiving and processing telemetry data from various sources, such as applications or libraries. It performs tasks such as data validation, aggregation, and routing before forwarding the data to a back-end for storage or analysis. The OTL collector is compounded by the following components, receivers, processors, and exporters.
The 5 Commandments of Open Telemetry
After gathering Open Telemetry best practices, we built a framework on how to apply Open Telemetry to our applications. The 5 Commandments of Open Telemetry outlines a 5‑step process for achieving centralized observability with Open Telemetry. The steps involve instrumenting applications, collecting data from these applications, storing it in a central location, analyzing the data, and correlating data from different sources.
1. Instrumentation - The first step is to instrument the applications with Open telemetry libraries and/or SDKs. These libraries and SDKs provide a consistent way to collect metrics, logs, and traces from the applications, regardless of the technology or vendor. We created custom documentation so that our clients can adapt their applications to use Open Telemetry SDKs.
2. Collection - Once the applications are instrumented, the next step is to collect the data using an open telemetry collector or an agent. The collector or agent receives the data from the applications and sends it to a central location for storage and analysis. Once telemetry data arrives at the collector, we are enriching it using data that comes from other sources.
3. Storage - The collected data is then stored in a central location, such as a time series database, log management system, or monitoring platform. This allows teams to access and analyze the data from a single location.
4. Analysis - Once the data is stored, users can use Open telemetry compatible tools to analyze the data. These tools provide a consistent way to visualize, search, and analyze the data, regardless of the technology or vendor. Tools like OpenSearch and Prometheus can be used to achieve this purpose.
5. Correlation - With the data from different services stored in a central location, we can now correlate data from different sources to gain a more comprehensive understanding of the applications’ past and current behavior.
By following these steps, teams can achieve centralized observability with Open Telemetry by having a consistent way to collect and report data from various systems and services, and by being able to analyze the data using a single set of tools, which allows us to gain a comprehensive understanding of the performance and behavior of a system, as well as to quickly identify and troubleshoot issues.
Final Thoughts
It’s worth noting that Open Telemetry is still a relatively new standard and it’s still evolving, but it has already been adopted by many companies and organizations. The Open Telemetry community is constantly working on improving the standard and adding new features, such as adding support for new languages, protocols, and platforms, which will make it even more powerful and easy to use.
There’s still a lot to be developed in centralized observability, but an important aspect of Open Telemetry is that it’s designed to work with other observability tools and standards, such as OpenSearch and Prometheus, which makes it easy to integrate with existing observability solutions like ours. This allows us to leverage the strengths of different tools and to use the best tool for the job, while still being able to correlate data from different sources and quickly identify and troubleshoot issues.
Centralized observability is a critical capability for any modern high-performing team and Open Telemetry provides a powerful solution for achieving it.
At synvert, we help customers define an observability strategy and implement it in complex environments and organizations.