Mobile BI Using Power BI
The Microsoft Power BI ecosystem includes the well-known Power BI Desktop and Power BI Service for creating and visualizing reports and dashboards, but did you know that it also offers a mobile application that allows users to check and interact with their dashboards from their phone or tablet? What’s more, it provides the developers with tools to improve dashboard and report visualization in mobile devices. Most of the features of Power BI reports still work in PBI Mobile, but the mobile app includes functionalities specifically aimed at improving the report visualization experience on mobile devices. Let’s have a look at the most relevant functionalities.
1. Power BI Mobile: main functionalities
1.1. Special design layouts for mobile devices
Power BI provides a special layout that recreates a phone interface to help developers to design reports and dashboards in PBI Desktop and PBI Service, easily changing from desktop to mobile layout.
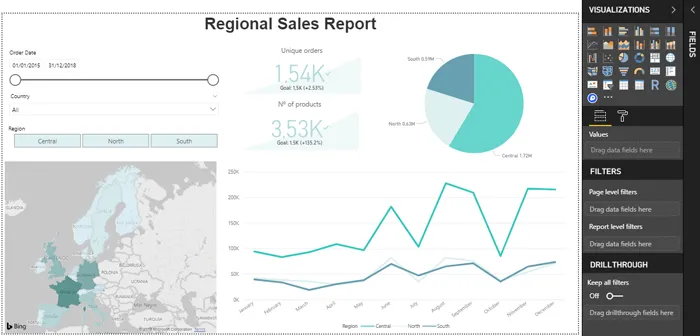
In PBI Desktop, visualizations are created and formatted in the desktop layout and can then be added to the mobile layout. For instance, we can jump from the Desktop report visualization below…
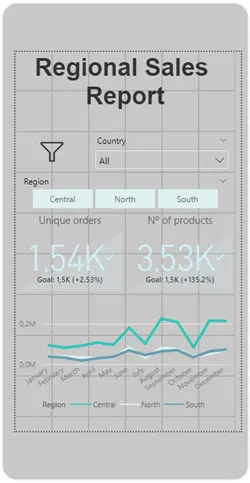
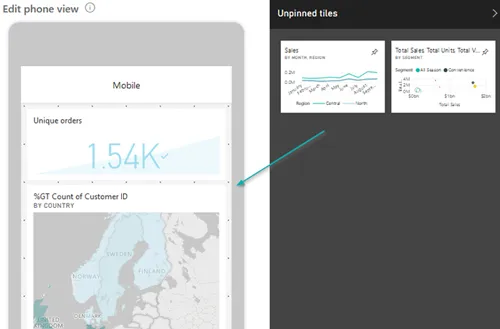
… to this Mobile report view, where we can rearrange views and filters to adapt our report to the mobile layout.
Similarly, in PBI Service, we can select from the visuals pinned to a dashboard for their inclusion in the mobile dashboard view.
1.2. Device compatibility
As with any other common mobile app, we can use PBI Mobile on our Android phone or tablet as well as on iPhones and iPads. Additionally, being a Microsoft product, it’s compatible with Windows 10 phones, and even allows us to consult some visual types, like KPIs or card tiles, using Apple Watch.
1.3. Special mobile interactivity for views
The PBI Mobile app has improved the view interaction experience, simplifying some of the most common tasks we do when consuming our reports.
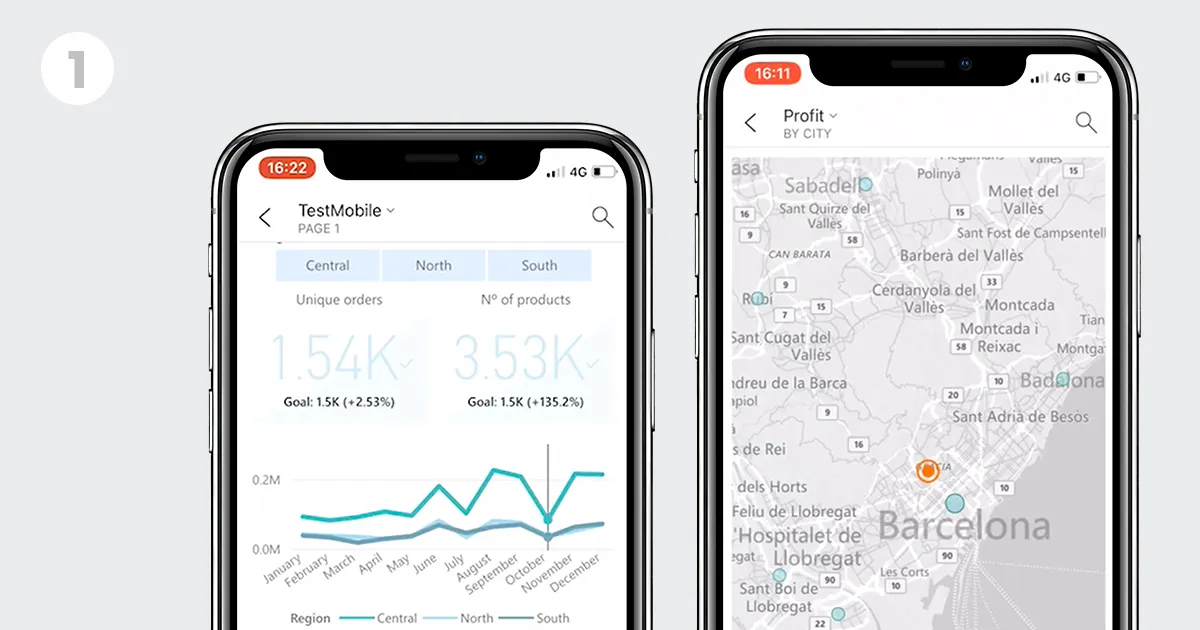
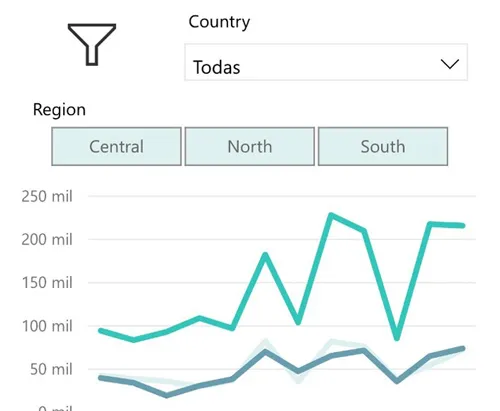
For example, in a line or a pie chart, we can tap on a specific point to check the values for that specific part of the visualization.
Or in a map view, we could tap the Centre Map icon to centre the view to our current location.
1.4. Responsive filters
All filters – or as they are known in the PBI world, slicers – can be made responsive, which will allow us to resize them to fit the space left in the report. This will work in any report type, but you’ll find this feature especially useful when designing layouts for mobile phones, as it will help make better use of space, leaving more room for data visualizations.
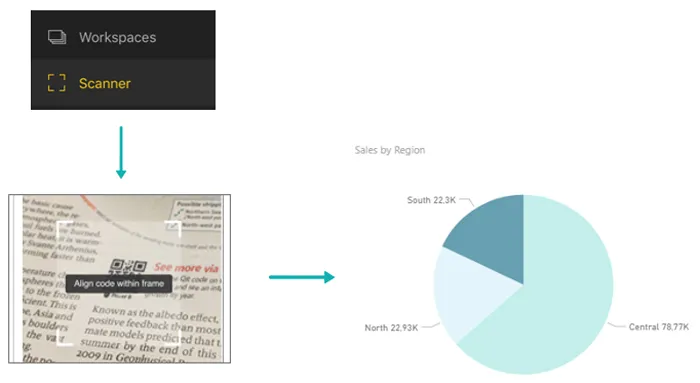
1.5. Scan bar code
The Power BI Mobile app can be used to scan QR codes in the real world then use them to open a specific view or report.
1.6. Q&A by text or voice
As we explained in one of our recent articles, one of the key features of Power BI is its Natural Language Processing ability which, through the Questions and Answers (Q&A) option, allows the user to discover insights in their data by simply making short requests like “show me the top 5 regions by sales”. PBI Mobile includes this functionality and even includes a voice request option.

1.7. Annotate and share views outside PBI
We can annotate reports in the PBI Mobile app, add our own comments, and then share the snapshot with others, even if they are not PBI users. We can share the snapshot using 3rd party apps, for example, email.
2. Limitations
Power BI Mobile is, in general, a great app for visualizing and interacting with our dashboards wherever we are, but there are a couple of areas that need improvement.
2.1. Lack of flexibility in the design layouts
Unlike the phone view, for which we have a specific designing layout, tablets will display the reports in the same way as in the Power BI Service, so reports cannot be designed for tablet landscape/portrait formats. Another catch is that the mobile layout is for a generic phone, so it is not possible to check how the reports will look on different devices with different screen sizes.
All the format changes must be done in the desktop view, so we cannot make any changes that only apply to the mobile view, for example, select a smaller font size, so that a specific visualization looks better on a smaller screen.
2.2. Limited map interactivity
Neither is map interactivity amongst PBI Mobile’s strongest features; even though there are specific features like the possibility to centre or filter the report by current location, interactivity with map views is very limited and does not allow simple actions like selecting a group of marks simultaneously.
Conclusions
Power BI Mobile allows PBI users to take their reports with them wherever they go. It provides different design options, so your dashboards and reports will look amazing no matter what device your users have, and it also includes specific functionalities to improve the view interaction experience on mobile devices.
If you want to start creating your own dashboards in Power BI so you can check them anywhere with PBI Mobile, contact us and we’ll give you a helping hand!