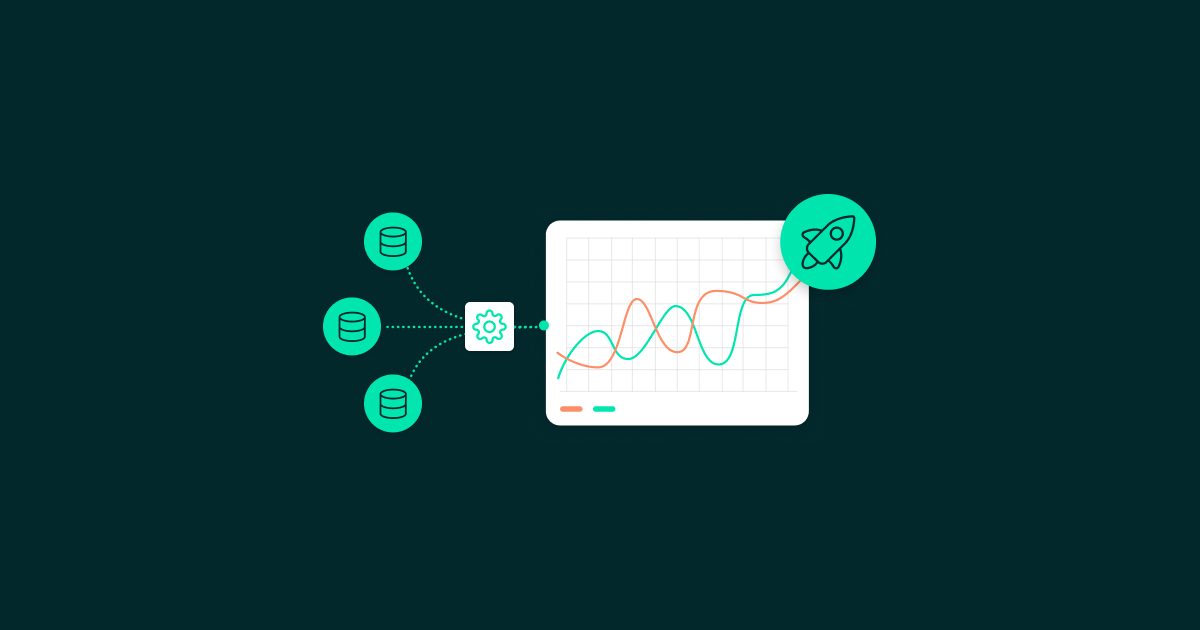

With data discovery, you can recognize patterns, trends and correlations that would otherwise remain hidden. Discover these connections and gain valuable insights through intuitive visualizations. We use powerful tools to make your data accessible and help you make informed decisions at a glance.

With data discovery, you can recognize patterns, trends and correlations that would otherwise remain hidden. Discover these connections and gain valuable insights through intuitive visualizations. We use powerful tools to make your data accessible and help you make informed decisions at a glance.
With data discovery, you can recognize patterns, trends and correlations that would otherwise remain hidden. Discover these connections and gain valuable insights through intuitive visualizations. We use powerful tools to make your data accessible and help you make informed decisions at a glance.

Data discovery refers to the exploratory process in which you dive deep into your data to discover patterns, trends and unknown correlations. It involves searching through data from various sources and analyzing it in such a way that new, valuable insights are gained.
With modern tools, you can explore data intuitively and interactively without the need for in-depth technical knowledge. This approach makes it possible to identify both known and unexpected information that may be relevant to business strategy or problem solving.
Data Visualization is used to convert complex and large amounts of data into easy-to-understand visual formats such as charts, graphs, maps or dashboards. This makes abstract figures and information tangible so that patterns and anomalies can be recognized more quickly.
Data visualizations help to present data in a comprehensible way, which not only makes it easier to communicate findings, but also speeds up decision-making. Interactive visualizations also allow you to delve deeper into the data independently and thus enable an interplay with data discovery.
We have many years of experience in using advanced visualization software such as Tableau, Qlik Sense, MicroStrategy and Power BI to make complex data sets understandable and usable. This extensive expertise enables us to deliver customized solutions that help you gain deeper insights into your data and make data-driven decisions.
Discovering hidden patterns can lead to faster and more informed decisions.
Visualizations make complex data understandable and thus promote collaboration.
Identifying and eliminating inconsistencies improves the reliability of the data.
Automated data discovery and visualization reduce the time required for data analysis.
Early detection of risks makes it possible to take preventive measures.
The discovery of new connections can lead to innovative ideas.


Introduction Power BI has become the heart of modern reporting landscapes. Yet, as projects scale, multiple developers collaborate, and ...

In our previous article, we dove into the whats and whys of Data Quality (DQ), and saw that it isn’t just a buzzword, it...

A Deep Dive Case Study into Methodologies and the RAGAS Library In our previous article, we explored why systematic evaluation of ...

Why does it matter? Large language models (LLMs) have moved beyond experimental phases to become mission-critical in modern enterprises. ...
You will shortly receive an email to activate your account.